Graphical front-ends¶
Python¶
The Python GUI requires PyQT4 to be installed in your system. We recommend
the wonderful Anaconda Python distribution.
Once you have all packages installed, go to runPy and type
python setup.py build_ext --inplace
The code should compile and a dynamic library should be generated, that is
copied to the directory pyGUI.
Go to pyGUI and type
python hazel.py
IDL¶
Although the code can be run in command line by modifying by hand the
input files, contains also two user friendly front-ends (GUI) for the
simple execution and analysis of the results. Note that the directory
IDL_routines has to be in your IDL path.
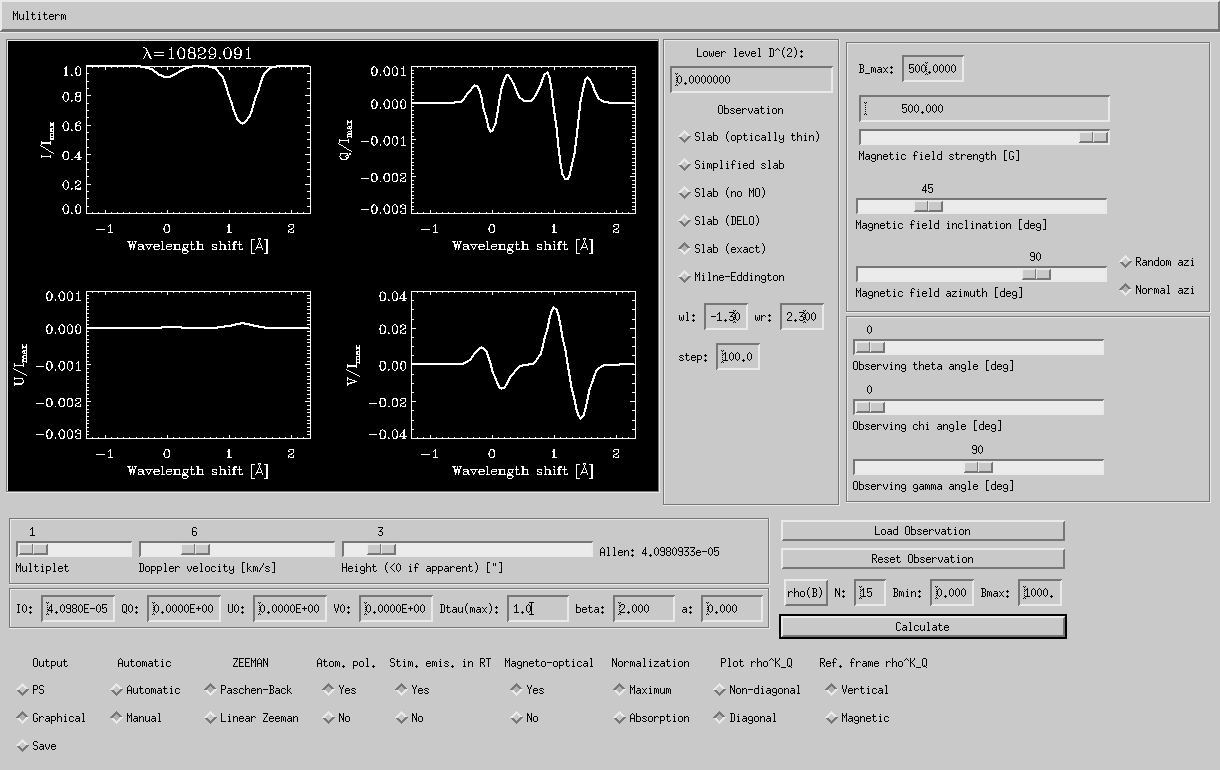
Screen dump of the graphical front-end used for the synthesis.
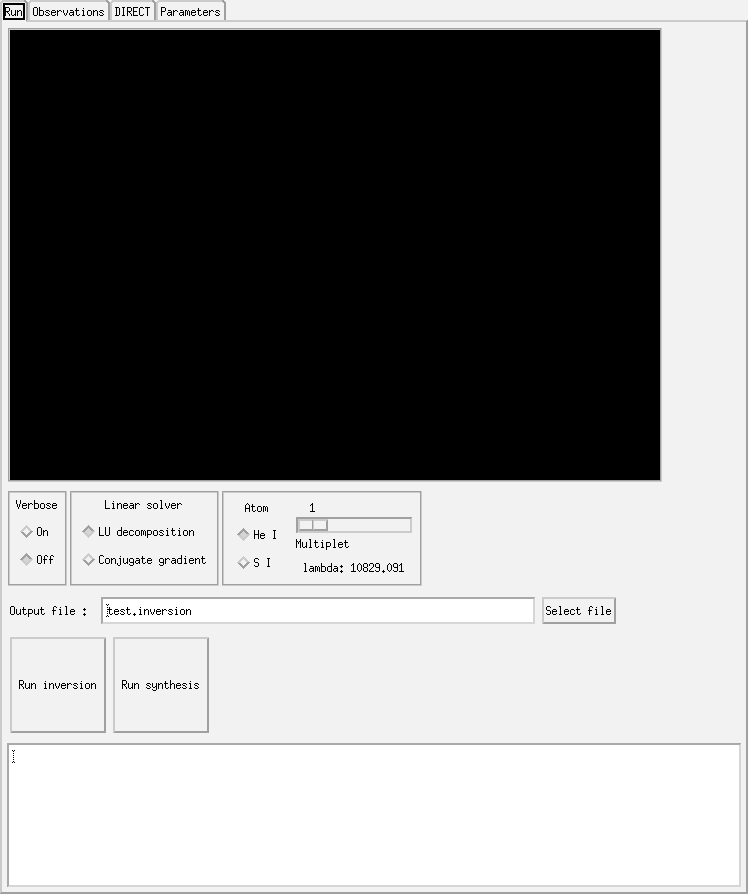
Screen dump of the graphical front-end used for the inversion.
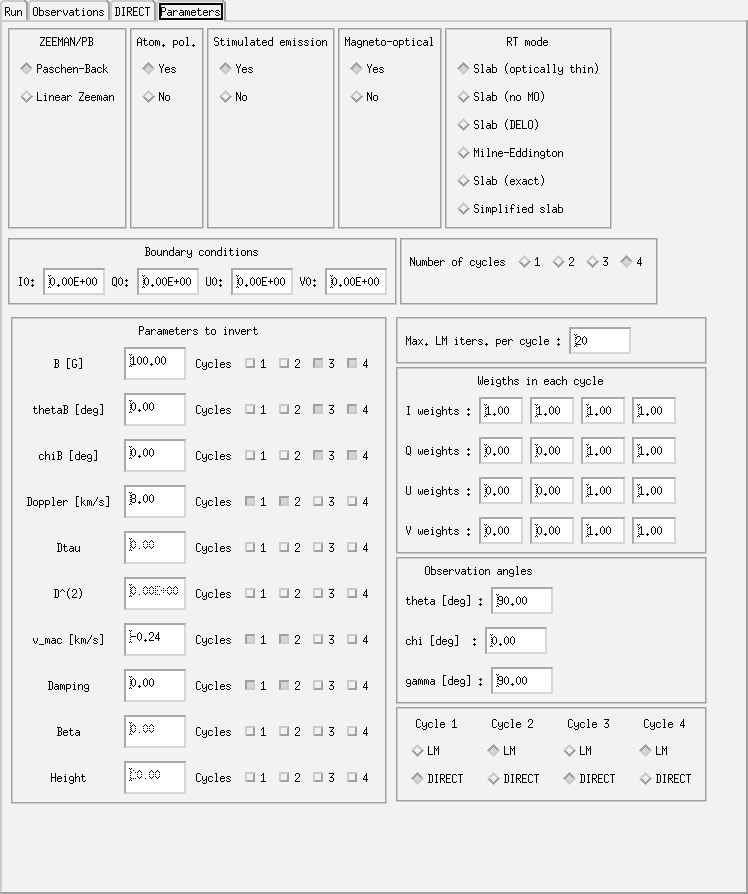
Screen dump of the graphical front-end used for the inversion.
### Synthesis
It is placed in the directory Widget_Synth and it is invoked with
the following commands:
IDL> .r hazel
IDL> hazel
Figure [fig:synthesis_GUI] shows the GUI for the synthesis mode. All
the parameters explained in the previous sections (fundamentally those
in §[sec:init_parameters]) are present in the GUI. All the parameters
are very simple to modify (when changing numerical values in the GUI,
always remember to press Return to activate the change) and clicking
on Calculate, the window is updated with the new Stokes profiles.
The GUI also shows the value of the solar radiation field when the
inclination of the line-of-sight and the wavelength of the multiplet is
changed. The value (which can be introduced in the value of \(I_0\)
as a boundary condition) is given next to the height of the slab and
indicated with the label “Allen”. In case of crashes, the GUI can be
restarted with the following command:
IDL> .r hazel
IDL> hazel, /reset
### Inversion
It is placed in the directory Widget_Inv and it is invoked with the
following commands:
IDL> .r hazel_inv
IDL> hazel_inv
Again, in case of crashes, the GUI can be restarted with the following command:
IDL> .r hazel_inv
IDL> hazel_inv, /reset
The GUI for the inversion is more complex because of the large amount of parameters that have to be changed. For this reason, the GUI is composed of 4 pages, as indicated in Fig. [fig:inversion_GUI].
The first page is used to select the output file, together with the atomic system and multiplet to be used. Finally, the button Run inversion will call and update the state of the best model in the plot window.
The second page is used simply to load the file with the observed Stokes profile. A button is also available to plot the observed data.
The third page controls the behavior of the DIRECT algorithm. It is
essentially a graphical representation of the direct_range.dat file.
Finally, the fourth page controls the behavior of the cycles, the value of the fixed parameters, the weights for each Stokes parameter and the level of physical realism introduced in the simulation.